
Zinc Zone
Overview
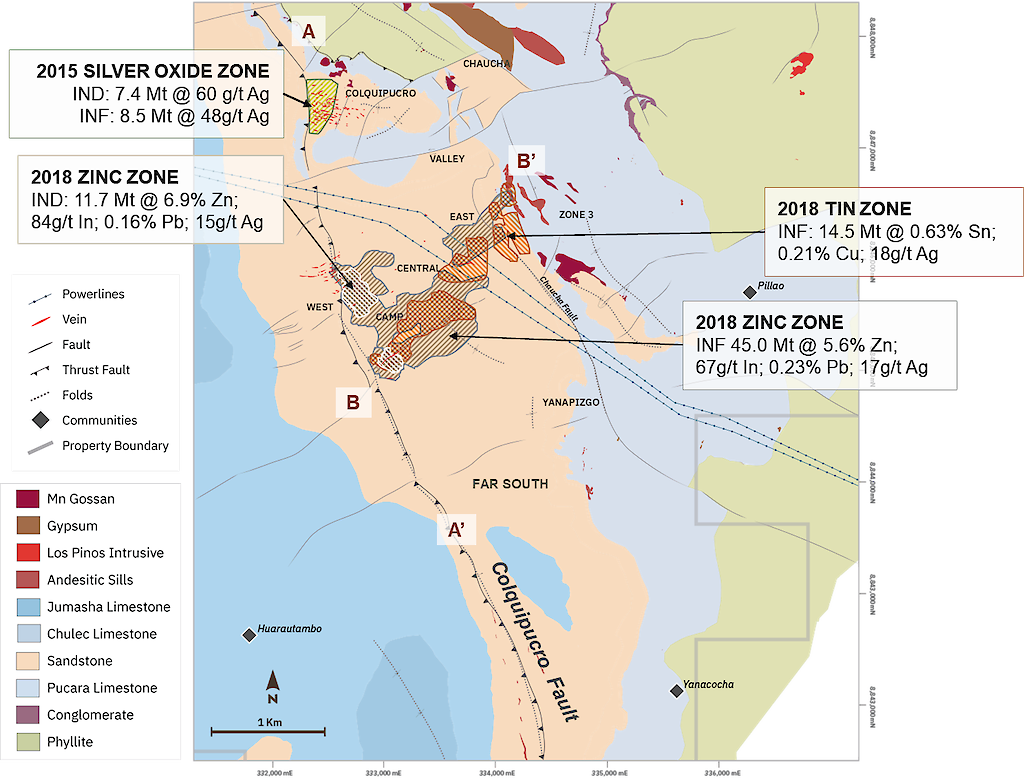
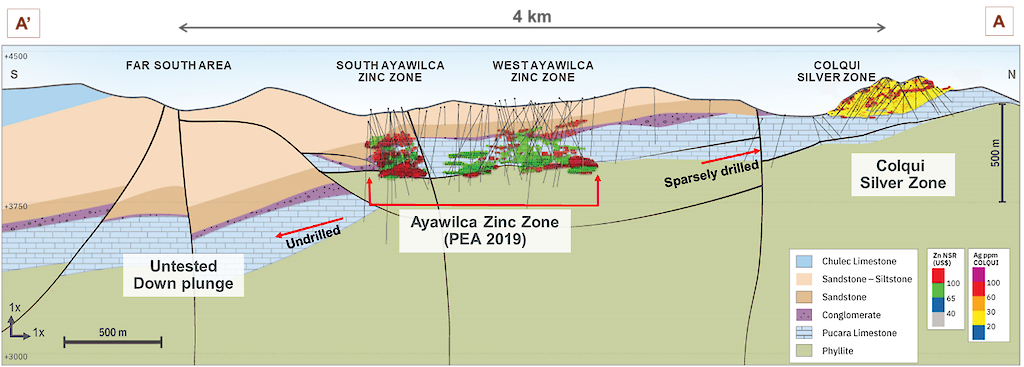
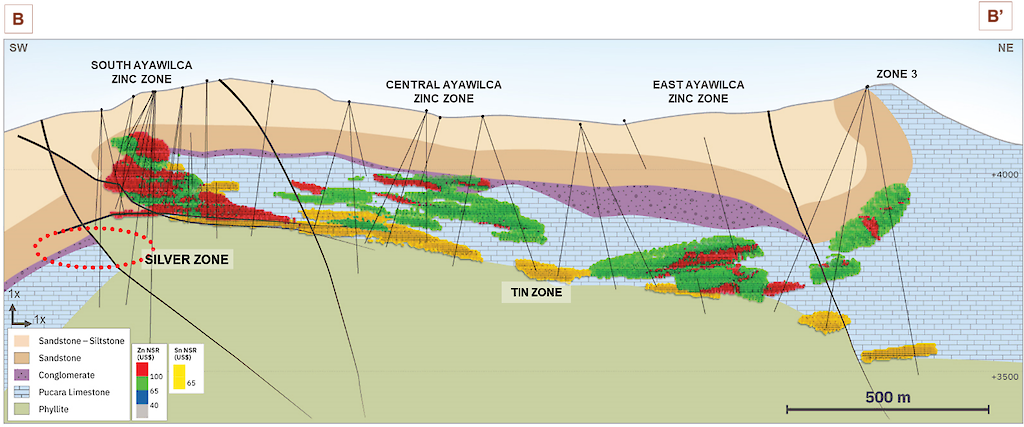
Zinc mineralization at Ayawilca occurs as massive sulphide lenses hosted in limestones of the Pucará Group (Triassic-Jurassic age). Pucará Group limestone occurs at depths of between 150 and 450 metres from surface in the resource area at Ayawilca, beneath sandstones and siltstones of the Goyllarisguizga (“Gollyar”) Group (Lower Cretaceous age) between 120 and 200 metres thick. Goyllar sandstones outcrop extensively over the resource area and dip gently to the east. Beneath the Pucará Group limestone lies basement rocks of the Excelsior Group (Paleozoic age), in fault contact with the limestone which also dips gently to the east.
An important NW-trending fault, the Colquipucro Fault, controls the high-grade zinc mineralization at West and South, where mineralized lenses are ‘stacked’ to form almost continuously mineralized zones with a vertical thickness of 100 -150 metres. Zinc mineralization occurs as both iron-rich sphalerite (marmatite) and low iron sphalerite. Silver mineralization is mostly associated with galena and silver sulfosalts. Gangue sulphide minerals include pyrite, pyrrhotite, and arsenopyrite. Other gangue minerals include chlorite, magnetite, clays, siderite and other complex carbonates, and quartz.
Mineral Resources
The Mineral Resource estimate for the Zinc Zone is provided by SLR Consulting (Canada) Ltd - see Table 1. .
Table 1 – Ayawilca Zinc Zone Mineral Resource as of January 1, 2024
Classification/ | Tonnage | NSR | Grade | Contained Metal | ||||||
Zn % | Ag g/t | Pb % | In g/t | Mlb Zn | Moz Ag | Mlb Pb | t In | |||
Indicated | ||||||||||
South | 13.8 | 128 | 6.64 | 19.3 | 0.2 | 120 | 2,020 | 8.6 | 52 | 1,655 |
West | 14.5 | 98 | 5.05 | 13.6 | 0.2 | 64 | 1,618 | 6.3 | 56 | 927 |
Total Indicated | 28.3 | 113 | 5.82 | 16.4 | 0.2 | 91 | 3,638 | 14.9 | 108 | 2,582 |
Inferred | ||||||||||
South | 4.8 | 79 | 3.81 | 24.2 | 0.2 | 34 | 406 | 3.8 | 19 | 163 |
West | 3.8 | 89 | 4.61 | 12.1 | 0.1 | 61 | 384 | 1.5 | 12 | 229 |
Central | 9.1 | 85 | 4.39 | 10.6 | 0.2 | 54 | 878 | 3.1 | 47 | 486 |
East | 13.5 | 81 | 4.13 | 14.4 | 0.2 | 40 | 1,229 | 6.3 | 55 | 536 |
Total Inferred | 31.2 | 83 | 4.21 | 14.5 | 0.2 | 45 | 2,898 | 14.6 | 133 | 1,414 |
Notes:
- CIM (2014) definitions were followed for Mineral Resources.
- The Mineral Resources have been reported within underground reporting shapes generated with Deswik Stope Optimizer (DSO) using a net smelter return (NSR) cut-off value of US$50/t. For the Central area, Mineral Resources were reported only within underground reporting shapes that also had a Zn grade above 3%.
- NSR value was based on estimated metallurgical recoveries, assumed metal prices, and smelter terms, which include payable factors, treatment charges, penalties, and refining charges. The NSR used for reporting is based on the following:
- Long term metal prices of US$1.40/lb Zn, US$25/oz Ag, and US$1.10/lb Pb.
- Net metallurgical recoveries of 92% Zn, 45% Ag, and 70% Pb.
- The NSR value for each block was calculated using the following NSR factors: US$18.04 per % Zn, US$0.33 per gram Ag, and US$11.92 per % Pb.
- The NSR value was calculated using the following formula: NSR = Zn(%)*US$18.04+Ag(g/t)*US$0.33+Pb(%)*US$11.92.
- Bulk densities were assigned to blocks by interpolation and remaining blocks by regression of Fe assay data or average sample data. Averages range between 3.20 t/m3 and 3.51 t/m3.
- Mineral Resources that are not Mineral Reserves do not have demonstrated economic viability.
- Numbers may not add due to rounding.