Tin Zone
Ayawilca Tin Zone
The Ayawilca Tin Zone forms flat-lying sulphide lenses at the contact of the limestone and phyllite, underlying the Zinc Zone at Central and East Ayawilca and as a lense at South Ayawilca. The Tin Zone mineralization consists of cassiterite (a common ore mineral of tin), pyrrhotite quartz, siderite chlorite, pyrite, and chalcopyrite. Quartz stockworks within phyllite also host tin-copper mineralization beneath the lenses, where the Company believes a feeder zone exists that could extend to depth.
Mineral resources at the Ayawilca Tin Zone are estimated to contain, as at January 1, 2024 (see Table 2):
- 22 million pounds of tin in the Indicated resource category
- 213 million pounds of tin in the Inferred resource catergory
Mineral Resources
The Mineral Resource estimate at the Ayawilca Tin Zone was provided by SLR Consulting (Canada) Ltd, and is highlighted in the following Table 3.
Table 3. Ayawilca Tin Zone Mineral Resources as of January 1, 2024
Classification | Tonnage | NSR | Grade | Contained Metal |
Indicated | 1.4 | 99 | 0.72 | 22 |
Inferred | 12.7 | 104 | 0.76 | 213 |
Notes:
- CIM (2014) definitions were followed for Mineral Resources.
- The Mineral Resources have been reported within underground reporting shapes generated with Deswik Stope Optimizer (DSO) using a net smelter return (NSR) cut-off value of US$60/t.
- The NSR value was based on estimated metallurgical recoveries, assumed metal prices, and smelter terms, which include payable factors, treatment charges, penalties, and refining charges. Metal price assumption is US$12.00/lb Sn. Metal recovery assumption is 64% Sn. The NSR value for each block was calculated using the following NSR factor: US$137.30 per % Sn.
- The NSR value was calculated using the following formula: US$NSR = Sn(%)*US$137.30.
- Bulk densities were assigned to blocks by interpolation and remaining blocks by regression of Fe assay data or average domain sample data. The average bulk density is 3.65 t/m3.
- Mineral Resources that are not Mineral Reserves do not have demonstrated economic viability.
- Numbers may not add due to rounding.
PEA Summary
Select exerpts from Tinka's February 28, 2024 news release.
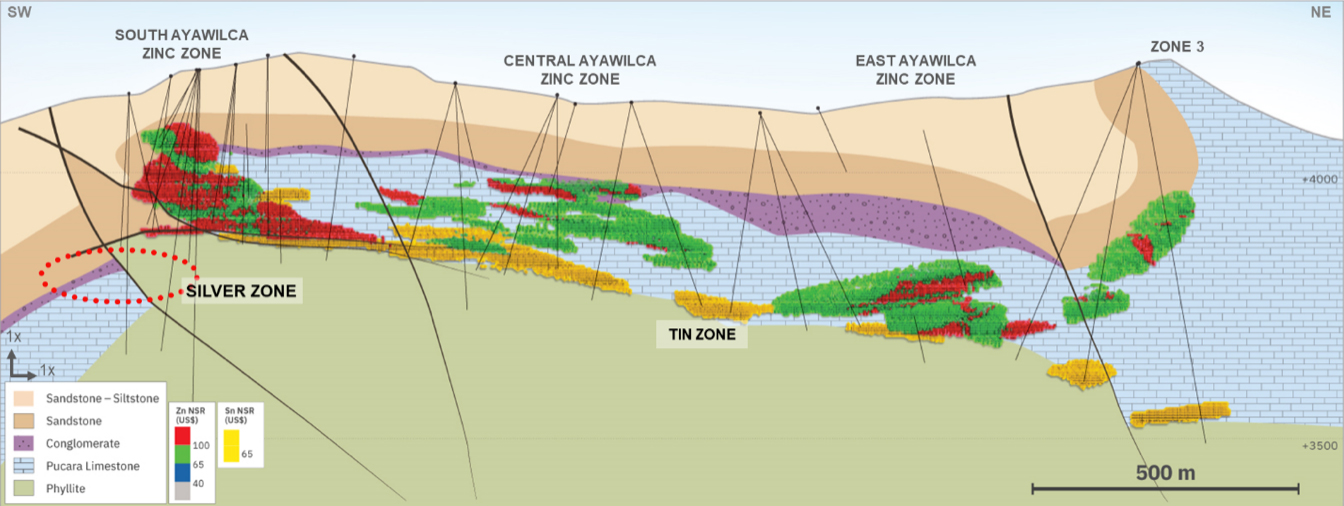
The Ayawilca Project is planned as an underground mine operation. For the purposes of the 2024 Preliminary Economic Analysis, the Zinc Zone (together with the Silver Zone) will be mined at a rate of 2.0 Mtpa, whilst the Tin Zone will be mined at a rate of 0.3 Mtpa. Mining of both zinc and tin zones commence together with each feeding separate processing plants. The LOM is 21 years for the Zinc Zone and 15 years for the Tin Zone. Mining in the Zinc and Tin Zones will utilize a long hole open stoping (“LHOS”) method in a transverse direction with level spacing ranging from 15 to 20 m. The Silver Zone uses LHOS in a longitudinal direction at a 20 m level spacing. A top-down overhand mining sequence is applied, working on top of paste-fill between sill pillars which are recovered. Three declines are planned from surface, initially two declines to access the South, Silver, and West areas and in later years the Central and East areas will be accessed by a third decline. The Tin Zones are also accessed through these planned declines.
Production is assumed to commence following 18 months of construction and commissioning. The mine plan for the Zinc and Silver Zones is based on mining a total of 41.2 million tonnes grading 5.02% Zn, 17.3 g/t silver and 0.19% lead over a 21-year LOM using an NSR cut-off of US$60/t. The Tin Zone is based on mining a total of 4.32 million tonnes grading 0.92% tin over a 15-year LOM using an NSR cut-off of US$80. The mill feed will be trucked to the surface via multiple ramp systems connecting the three mine portals to the underground infrastructure and accessing production areas starting at the South and West areas of the Zinc Zone, the Silver Zone, and the high recovery area of the Tin Zone (see Figures 2 and 3).
Figure 2. Mining Schedule for Zinc-Silver-Lead Plant (left) and Tin Plant (right) showing Average Grades by Year
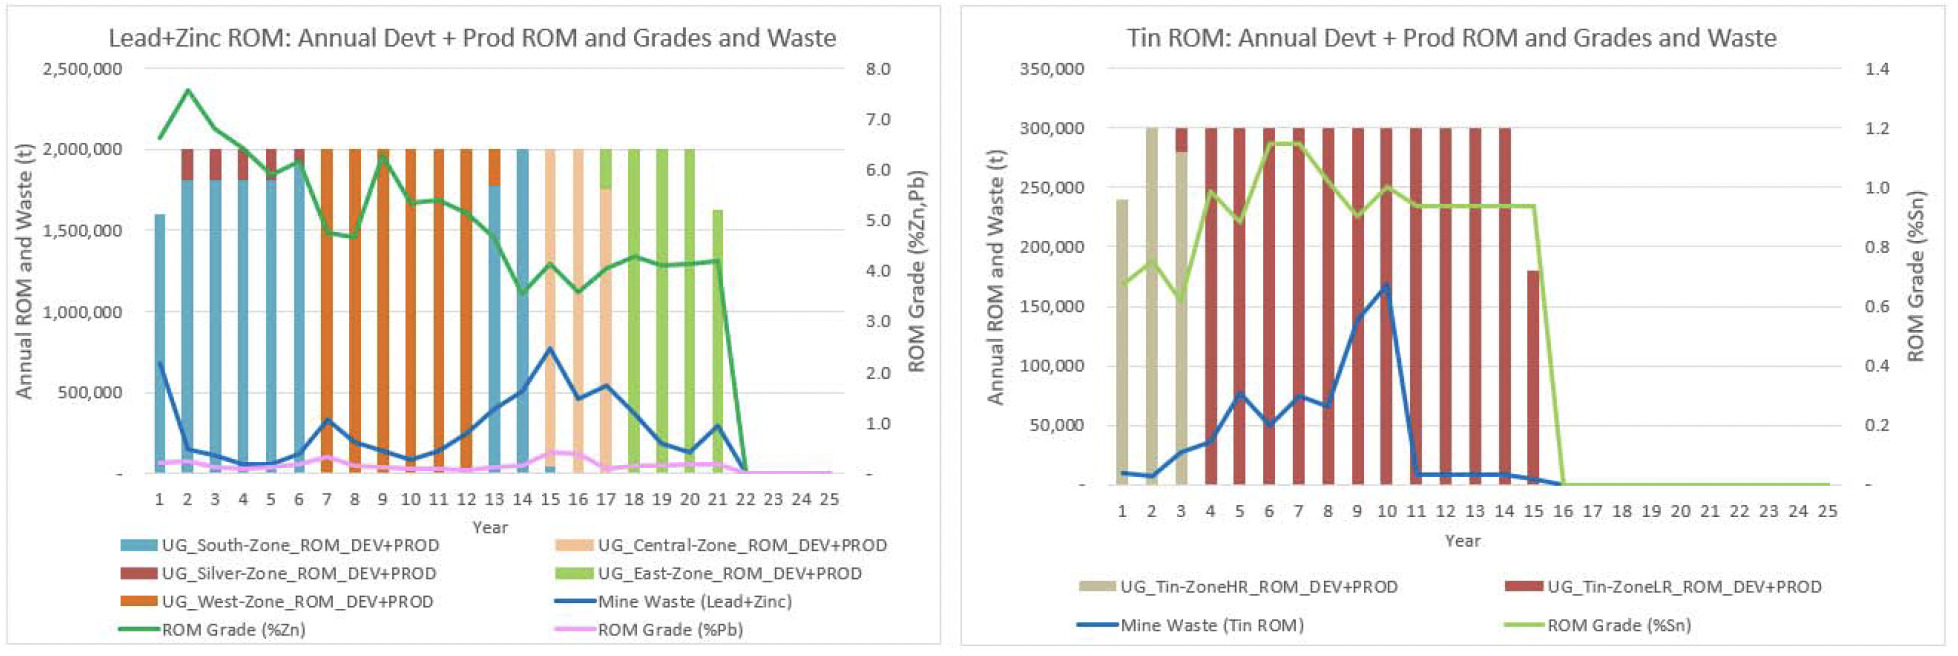
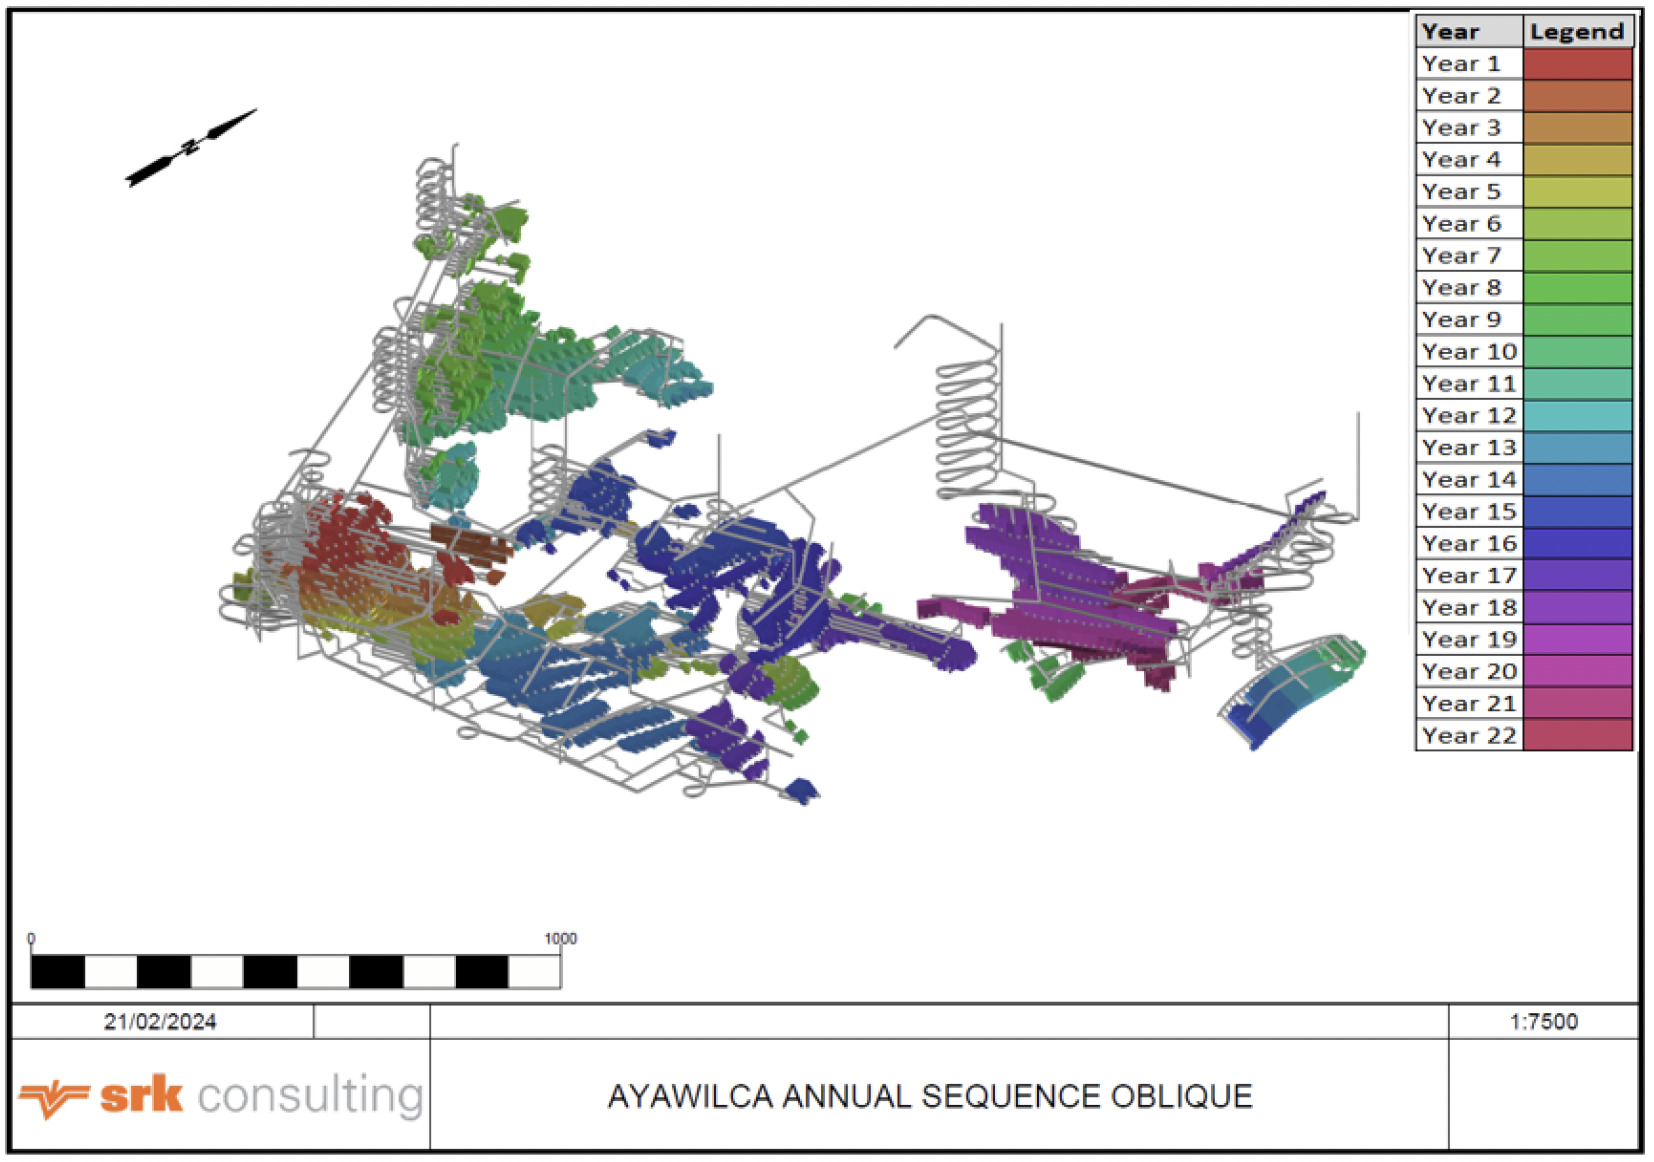
Figure 3. Oblique view of Ayawilca mine design and stopes showing LOM Schedule
Metallurgy and Processing
Processing of the zinc-rich mineralization will be through a conventional crushing and grinding circuit followed by froth flotation, concentrate thickening and filtration. Metallurgical test work indicates a zinc concentrate grading 50% zinc can be produced from Zinc and Silver Zones with 92% of the zinc in the Zinc Zone recovered to the zinc concentrate (see news release of June 5, 2019), and 87% of the zinc in the Silver Zone recovered to the zinc concentrate. The lead concentrate is expected to contain 47% lead and average 3,140 g/t silver over the LOM. Based on preliminary metallurgical test work, 45% of the silver in the Zinc Zone is expected to report to the lead concentrate and be payable, while 40% of the silver is expected to report to the zinc concentrate and not be payable. In the Silver Zone, 85% of the silver (and 85% of the lead) is expected to report as a credit to a commercial lead concentrate.
Table 4. LOM Head Grade and Metallurgical Recovery for the Tin Circuit
Product | Average Grade LOM | Metallurgical Recoveries (%) | ||
Tin (%) | Av. NSR (US$/t) | Tin – Coarse | Tin – Fine | |
Feed grade Tin Concentrate | 0.92 50.0 | 106 | 90 | 50 |
Initial metallurgical testwork indicates that a tin concentrate grading 50% with 90% recovery can be produced from the high recovery (i.e., coarse tin) part of the Tin Zone, and a tin concentrate grading 50% with 50% recovery can be produced from the lower recovery (i.e., fine tin) part of the Tin Zone. The coarse tin represents 19% of the overall tin feed. The tin concentrates are anticipated to have markets in Asia and therefore all of the tin concentrate produced is assumed to be shipped overseas. Off-site charges include transport, treatment charges, refining charges, and penalties at refinery and summarized below in Table 5.
Table 5. Off-Site Charges
Description | Zinc Concentrate | Silver-Lead Concentrate | Tin Concentrate |
Transport to Port/Local refinery Port Charges Shipping to overseas smelter (FOB) Local refinery Treatment Charge (TC) Overseas Treatment Charge (TC) Ag Refining Charge (RC) Indium Credit (Overseas only) Sulphur Penalty Iron Penalty | US$40/wmt US$25/wmt US$45/wmt US$220/dmt US$220/dmt - US$20.00/dmt
US$7.50/dmt | US$40/wmt US$50/wmt US$15/wmt - US$50/dmt US$0.80/oz - | US$40/wmt US$50/wmt US$15/wmt - US$750/dmt - - US$75/dmt 0.7 units |
Notes: wmt = wet metric tonne. dmt = dry metric tonne
For silver-lead concentrates grading less than 2,500 g/t Ag, treatment charge is $150/dmt and refining charge is $1.00/oz Ag.
Approximately 60% of the tailings will be thickened and filtered for dry stack tailings disposal. The remaining 40% will be prepared as pastefill and reticulated to the underground mine to be used as structural backfill.
Infrastructure
Access
There is a good existing road network from the Project to the coast of Peru. The Project lies approximately 250 km from the Port of Callao and a zinc refinery. The road leaving the Project is an all-weather gravel road that crosses the high central Andes for about 60 km before joining a bitumen road to the coast and then to the Port of Callao via the Pan-American highway. The Cajamarquilla zinc refinery is situated on the eastern outskirts of the city of Lima with good access from the highway.
Tailings and Mine Waste Management
The tailings and mine waste concept for the Ayawilca PEA is based on a commitment to implementing best available practices and best available technologies, as described in the International Council of Mining and Metals (“ICMM”) Global Industry Standard for Tailings Management. The location of the TSF has been selected to minimize any potential risks for downstream areas. It is envisaged that:
- 100% of mine waste rock and 40% of tailings production will be re-used as underground mine backfill;
- On-surface tailings will be processed as filtered tailings and stacked at a secure and prepared facility. This method will reduce the environmental footprint and the risk of failure and the attendant environmental impacts, while also minimizing water consumption.
- The filtered tailings facility has been located adjacent to the process plant area, minimizing the haul distance for the tailings and reducing environmental and social impacts.
Power
A new electricity substation is currently under construction 4.7 km from Ayawilca by a 3rd party mining company. The Project will include construction of a transmission line from this substation to a substation at Ayawilca. Tinka has recently received approval of a pre-operation environmental study (“EPO”) to access 220kV / 23 MW power supply through a substation at Ayawilca. Ayawilca is now planned to become connected to the national electrical grid.
Capital and Operating Costs
The major components of the initial capital expenditure of US$$382 million include US$89.4 million for the zinc-silver-lead processing plant, US$29.0 million for the tin processing plant, US$34.0 million for on-site infrastructure, US$56.6 million for mine equipment and underground pre-production development, US$17.8 million for site preparation of the filtered tailings storage facility and related mobile equipment, $15.5 million for the pastefill plant, $52.4 million for other surface facilities, and US$45.0 million other costs including indirects and owners costs. Contingency in the initial capital totals US$76.2million. Total sustaining capital is $313.1 million over the 21-year mine life. The major components of sustaining capital are US$176.3 million for mining equipment (including major components and rebuilds) and materials handling, $49.8 million for mine development, ventilation and water management, US$46.0 million for tailings management. Contingency in sustaining capital totals US$40.8 million.
The estimated capital costs, over the life of the Project, are as follows in Table 6.
Table 6. Capital Costs Summary
Capital Cost Item | Initial (US$ M) | Sustaining (US$ M) | LOM Total (US$ M) |
Mining & mine development Process plant – Zn/Ag/Pb Process plant - Sn Pastefill plant Tailings Other surface facilities Subtotal Other indirects Owner’s costs Contingency | 56.6 89.4 29.0 15.5 17.8 52.4 261.7 34.7 10.3 76.2 | 226.3 - - - 46.0 - 272.2 - - 40.8 | 282.9 89.4 29.0 15.5 63.7 52.4 534.0 34.7 10.3
117.0 |
TOTAL PROJECT (US$ M) | 381.8 | 313.1 | 694.9 |
CLOSURE COSTS (US$ M) |
|
| 19.5 |
Numbers may not add due to rounding
The estimated operating costs, over the life of the Project, are as follows in Table 7.
Table 7. Operating Costs per Mining Method for the Zinc and Tin Plants
| US$/t Processed | ||
Operating Cost Item | Zinc Plant | Tin Plant | Weighted Average |
Mining Backfill Sub-total Processing Tailings G&A | 13.15 3.73 16.88 11.00 0.94 6.23 | 13.15 3.73 16.88 23.63 0.94 6.23 | 13.15 3.72 16.88 12.20 0.94 6.23 |
TOTAL PROJECT | 35.06 | 47.68 | 36.25 |
Sensitivities
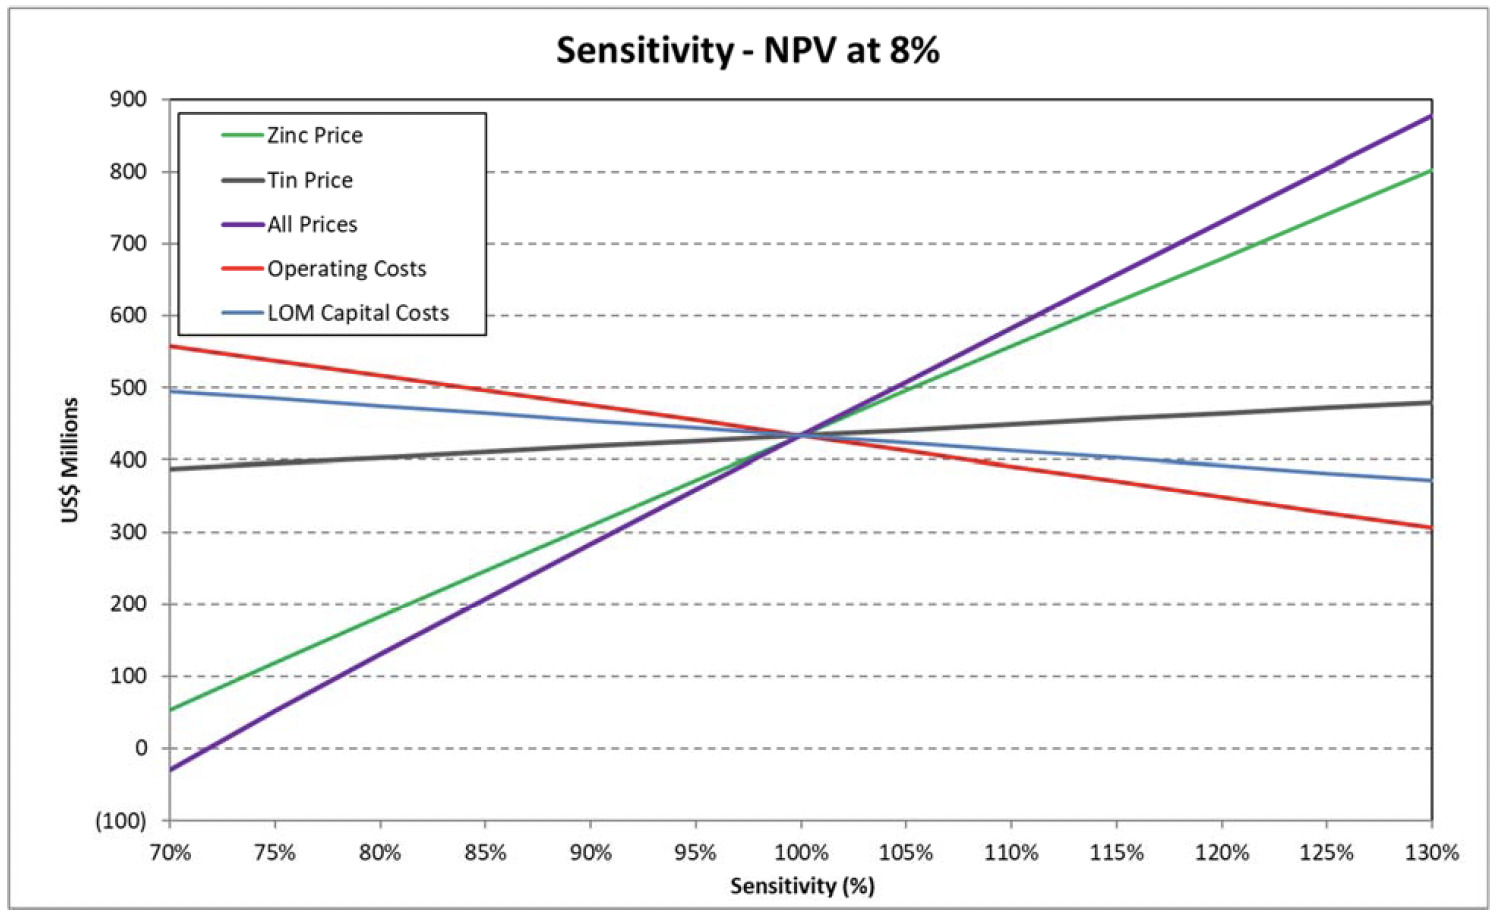
The Ayawilca project is strongly leveraged to zinc and to a lesser extent tin and silver prices. A 25% increase on the base case zinc price (from US$1.30 to US$1.625) results in an after-tax NPV8% of US$741 million. A 25% increase on the base case tin price (from US$11.00 to US$13.75) results in an after-tax NPV8% of $472 million. See Figure 4.
Figure 4. PEA Sensitivities for Metals Prices, Operating Cost and LOM Capital Costs
Opportunities and Exploration Potential
The Ayawilca deposit has not been fully delineated by exploration drilling, and several of the zones remain open along strike and at depth. Opportunities for additional value at Ayawilca not captured in the PEA include, but not limited to:
- Potential to extend the Zinc Zone deposits to depth at the East and West areas with more drilling;
- Potential to extend the Tin Zone to depth at the Central area, in particular where a steeply-dipping feeder zone is interpreted and is untested by drilling;
- Potential to extend the Silver Zone along strike and at depth – only 500 m of strike length is tested to date;
- Optimization of zinc recovery to a zinc concentrate (currently 92%) and silver recovery to a silver-lead concentrate in the Zinc Zone (currently 45%) with more detailed metallurgical test work;
- Optimization of tin recovery to a tin concentrate from the low recovery domain (currently 50%) with more detailed metallurgical testwork.
Mineral Resource Estimation
The updated Ayawilca Project Mineral Resource estimate for the Zinc Zone, Silver Zone, and Tin Zone is summarized in Table 8, Table 9, and Table 10, respectively, as estimated by SLR Consulting (Canada) Ltd (SLR). For the purposes of demonstrating ‘Reasonable Prospects for Eventual Economic Extraction’ (RPEEE), Mineral Resources are constrained within underground reporting shapes generated in Deswik Stope Optimizer (“DSO”) using a minimum mining width of three metres and an NSR cut-off value of $50/t for the Zinc and Silver Zones and $60/t for the Tin Zone. Canadian Institute of Mining, Metallurgy and Petroleum (“CIM”) Definition Standards for Mineral Resources and Mineral Reserves dated May 10, 2014 (“CIM (2014)” definitions) are used for classification of Mineral Resources. The Tin Zone, Zinc Zone and Silver Zone resources do not overlap.
To satisfy RPEEE for an underground mining scenario, Tinka is reporting Mineral Resources within potentially mineable shapes (i.e., stopes) thereby demonstrating the spatial continuity of the mineralization. Where the potentially mineable volumes (i.e., stopes) contain smaller zones of mineralization with values below the stated cut-off, this lower grade material is included in the Mineral Resource estimate.
The updated Mineral Resources estimate as at January 1st, 2024, contains the following:
- Indicated Zinc Zone Mineral Resource of 28.3 Mt grading 5.82% zinc, 16.4 g/t silver, 0.2% lead & 91 g/t indium containing:
- 3.64 billion pounds of zinc;
- 14.9 million ounces of silver;
- 108 million pounds of lead; and
- 2,582 tonnes of indium.
- Inferred Zinc Zone Mineral Resource of 31.2 Mt grading 4.21% zinc, 14.5 g/t silver, 0.2% lead & 45 g/t indium containing:
- 2.90 billion pounds of zinc;
- 14.6 million ounces of silver;
- 133 million pounds of lead; and
- 1,414 tonnes of indium.
- Inferred Silver Zone Mineral Resource of 1.0 Mt grading 111.4 g/t silver, 1.54% zinc, & 0.5% lead containing:
- 3.7 million ounces of silver;
- 35 million pounds of zinc; and
- 12 million pounds of lead.
- Indicated Tin Zone Mineral Resource of 1.4 million tonnes grading 0.72% tin, containing:
- 22 million pounds of tin.
- Inferred Tin Mineral Resource of 12.7 million tonnes grading 0.76% tin, containing:
- 213 million pounds of tin.
No Mineral Reserves have been estimated at the Project.
The Zinc, Silver, and Tin Zone Mineral Resource estimates for the Ayawilca Project were updated by SLR using the drill results available to May 31, 2023. The deposit drill database includes 249 drill holes totalling 94,258 m. An additional 35 drill holes totalling 12,216 m have been added since the previous update dated August 30, 2021. Three-dimensional (3D) wireframe models were generated using an approximate NSR cut-off value of $40/t for the Zinc Zone. For the Tin Zone, a 0.2% Sn or NSR cut-off value of $30/t was used for wireframe models. Prior to compositing to two metre lengths, high tin, silver, and lead values were capped for each zone individually. Zinc, silver, lead, tin, and indium high grade outliers were constrained during interpolation on a per domain basis. Block model grades within the wireframe models were interpolated by inverse distance cubed (ID3). Despite lead grades generally being low, it is assumed that lead and silver will be recovered in a lead concentrate. Density was assigned to blocks within the resource wireframes by ID3. Where density sample data was insufficient for interpolation, density values were derived from a regression equation based on the iron value of the block. Figures 5 and 6 show the Mineral Resource wireframes in plan and 3D views. Cross sections of the resource wireframes are shown in Figures 7.
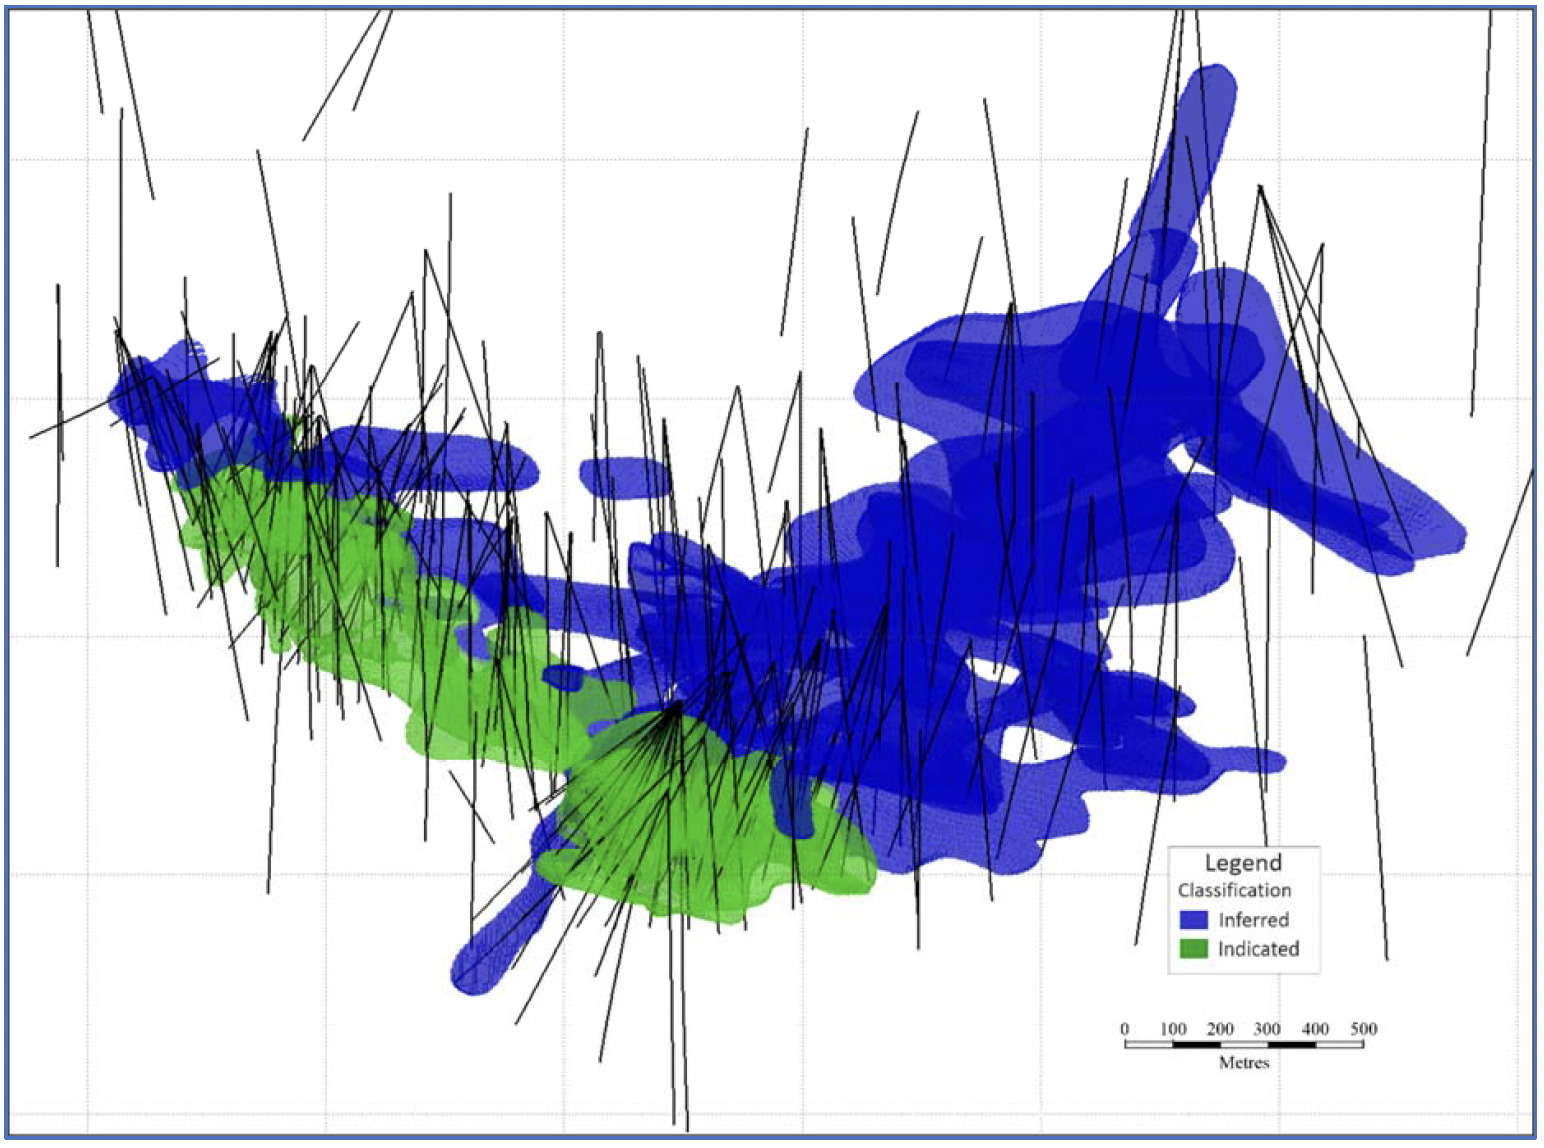
The Mineral Resources were classified following CIM (2014) definitions as Indicated and Inferred using drill hole spacing based criterion, mineralization continuity, and thickness. The drill hole spacing within a resource area assigned the Indicated category commonly ranges from 40 m to 70 m.
Table 10: Ayawilca Tin Zone Mineral Resources as of January 1, 2024
Classification | Tonnage | NSR | Grade | Contained Metal |
Indicated | 1.4 | 99 | 0.72 | 22 |
Inferred | 12.7 | 104 | 0.76 | 213 |
Notes:
- CIM (2014) definitions were followed for Mineral Resources.
- The Mineral Resources have been reported within underground reporting shapes generated with Deswik Stope Optimizer (DSO) using a net smelter return (NSR) cut-off value of US$60/t.
- The NSR value was based on estimated metallurgical recoveries, assumed metal prices, and smelter terms, which include payable factors, treatment charges, penalties, and refining charges. Metal price assumption is US$12.00/lb Sn. Metal recovery assumption is 64% Sn. The NSR value for each block was calculated using the following NSR factor: US$137.30 per % Sn.
- The NSR value was calculated using the following formula: US$NSR = Sn(%)*US$137.30.
- Bulk densities were assigned to blocks by interpolation and remaining blocks by regression of Fe assay data or average domain sample data. The average bulk density is 3.65 t/m3.
- Mineral Resources that are not Mineral Reserves do not have demonstrated economic viability.
- Numbers may not add due to rounding.
Density
A total of 4,226 density measurements are located within the wireframe models. This represents a nearly five-fold increase in the number of density measurements available when compared to the previous estimate. A linear regression established between core density data and iron assays was used to assign a density value to resource blocks that were not interpolated. Linear regression equations were established for each area separately. Overall, the density values in the updated 2024 mineral resource estimate have decreased by around 5% over the 2021 estimate.
In the previous estimate, density values were assigned to all blocks in each area based on the average density sample value after removing outliers. In SLR’s opinion, density values were slightly overestimated in the previous estimate and the updated estimation methodology is more rigorous and better reflects local variations within the resource domains.
SLR notes, however, that using a regression equation based on iron is not without flaws. These include:
- Overlimit iron assays will underestimate the iron content and low bias the density.
- There is a negative correlation with high zinc and iron values, i.e., there is a potential to low bias Zn-rich areas.
A small proportion of blocks within the South and West areas are assigned a density value using the iron regression equation. Within the Central area, however, approximately 50% of blocks are assigned a density value using the iron regression equation and within the East area, there are not enough samples to establish a correlation between density and iron.
Figure 5. Plan of Ayawilca Drillhole Map Highlighting Updated Mineral Resource wireframes.
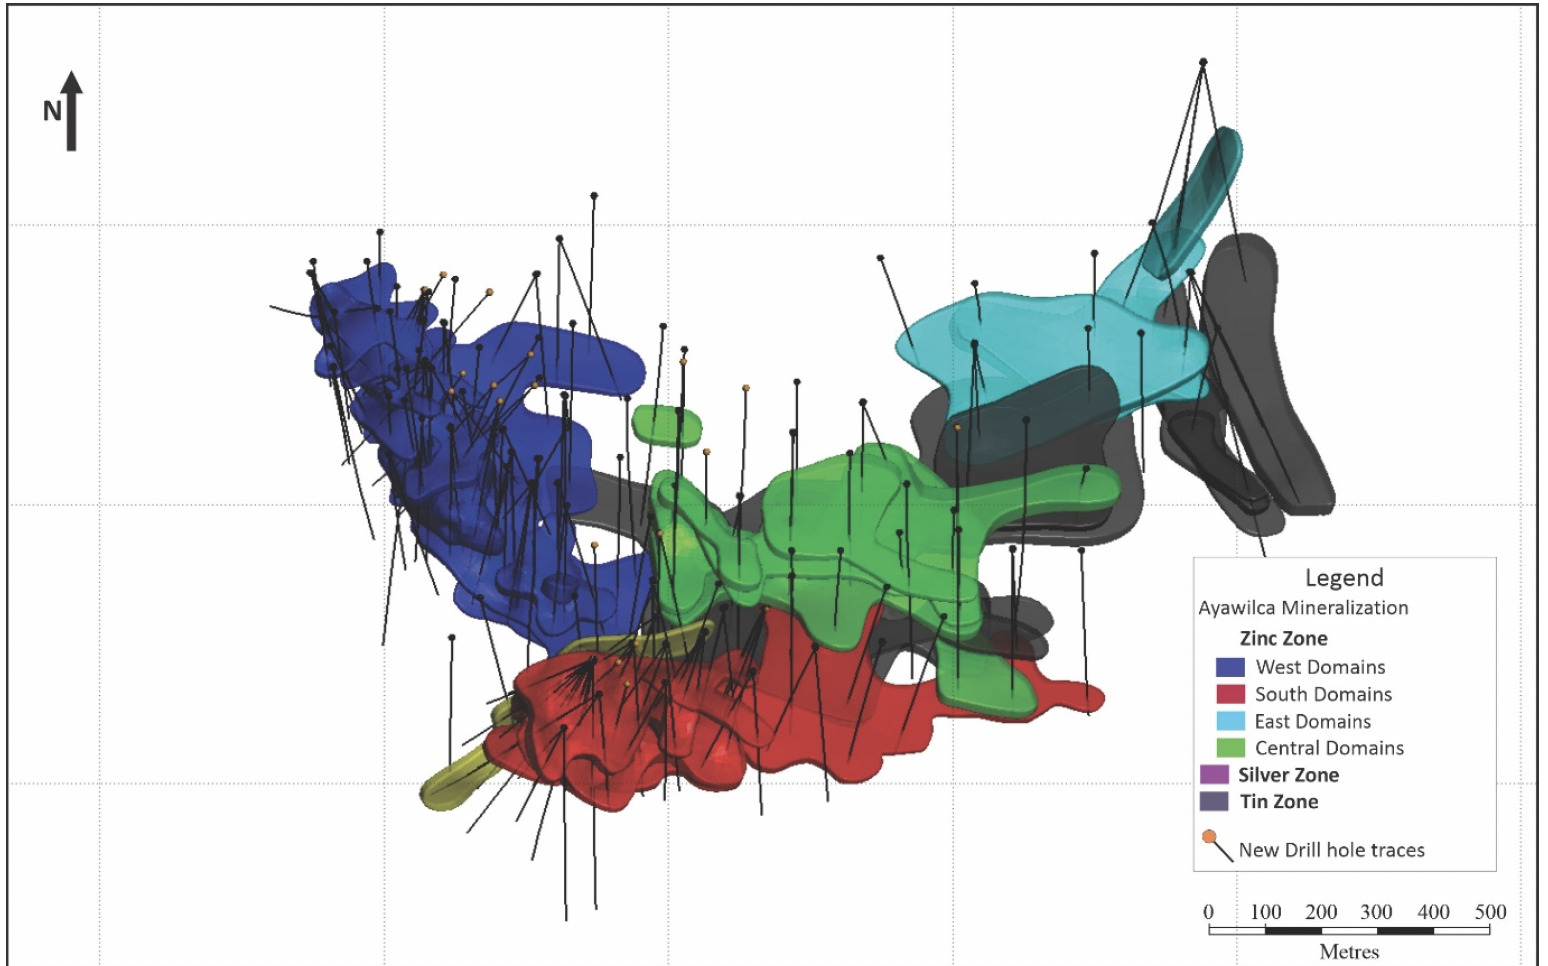
Figure 6. Plan view of Ayawilca Zinc Zone Resource Wireframes and Classification Model
Comparison to Previous Mineral Resource Estimate
Drilling at Ayawilca in 2022 and 2023 since the previous estimate (effective date August 30, 2021) has improved the understanding of the lithological setting and faults controlling the zinc, tin, and silver mineralization. The updated geological model better constrains the mineralized zones especially within the zinc zone domains at West Ayawilca.
Tin Zone
Although there was no change to the NSR cut-off value for the Tin Zone, globally, the current Tin Zone Mineral Resource estimate has increased in both tonnage and contained metal, but with lower average grades. Indicated Mineral Resources have been declared in the current estimate and Inferred Mineral Resources have increased in tonnage and metal content by 51% and 13% respectively, but average grades have decreased by approximately 25%.
The most substantial impact to the Tin Zone Mineral Resource in the current estimate is upgrading a portion of Inferred Mineral Resources to Indicated Mineral Resources and reporting the summation of all blocks within resource reporting shapes (i.e., stopes) versus a block cut-off value.
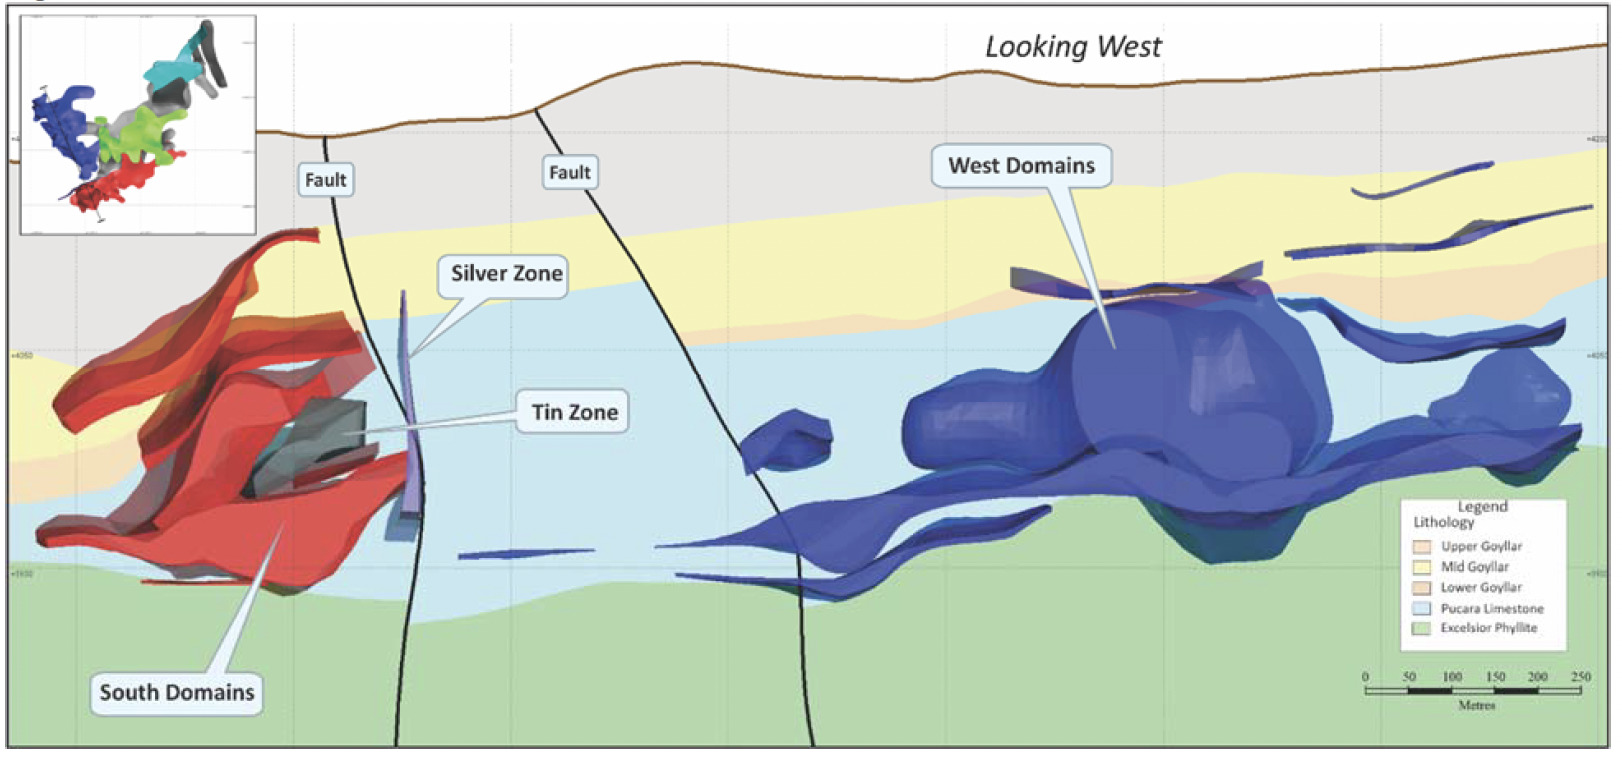
Figure 7. Generalized SW-NW longitudinal section of Zinc Zone and Tin Zone at South and Central Areas
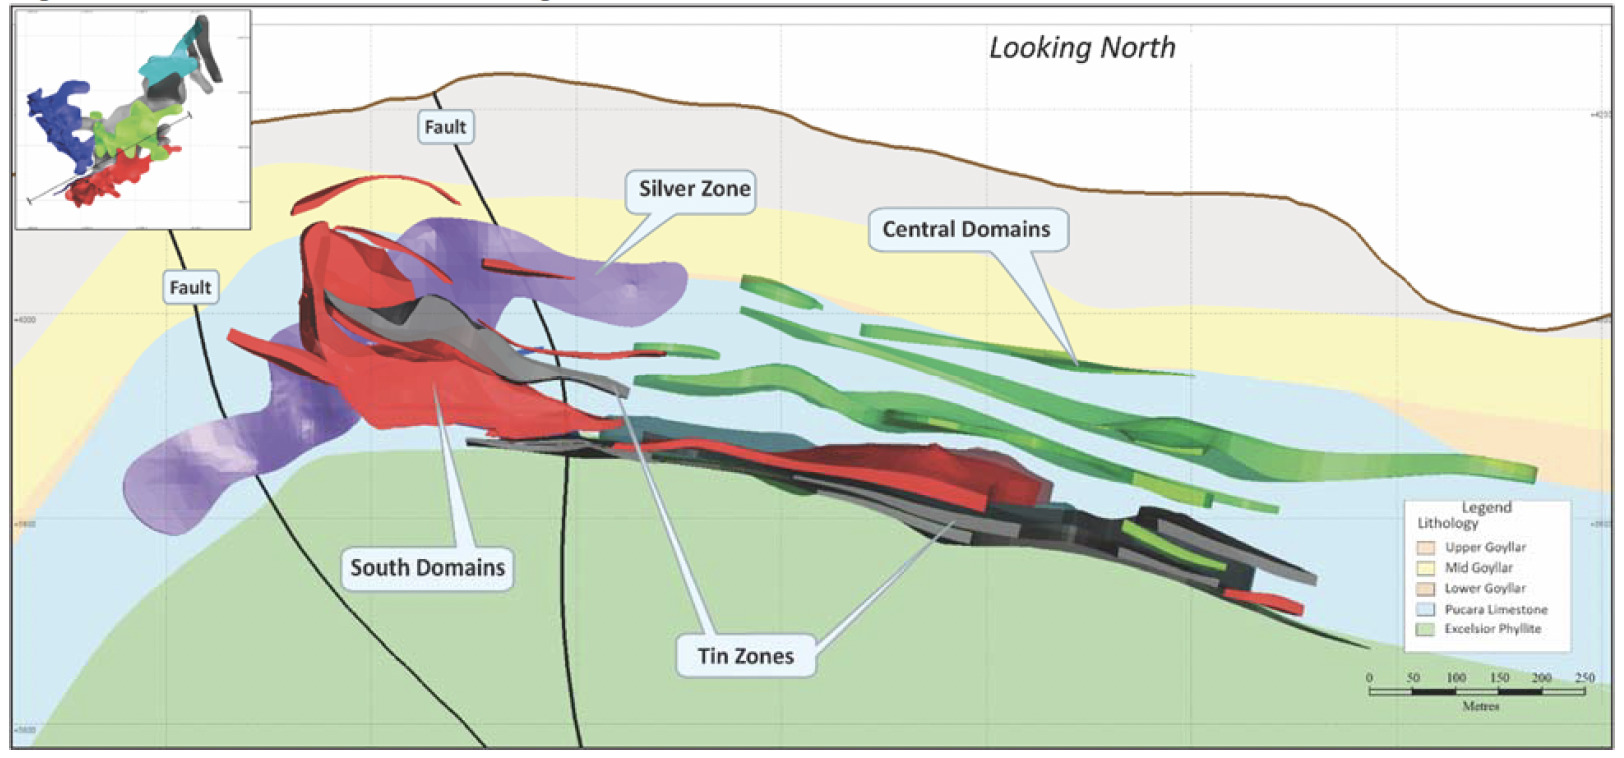
Figure 8. Generalized N-S cross section of Zinc Zone, Tin Zone and Silver Zone at South and West Areas